Key figures: Homeowners, mortgage servicers, US Treasury Secretary Timothy Geithner, Housing and Urban Development Secretary Shaun Donovan, economist Morris Davis (Lincoln Institute), RealtyTrac analysts
Summary
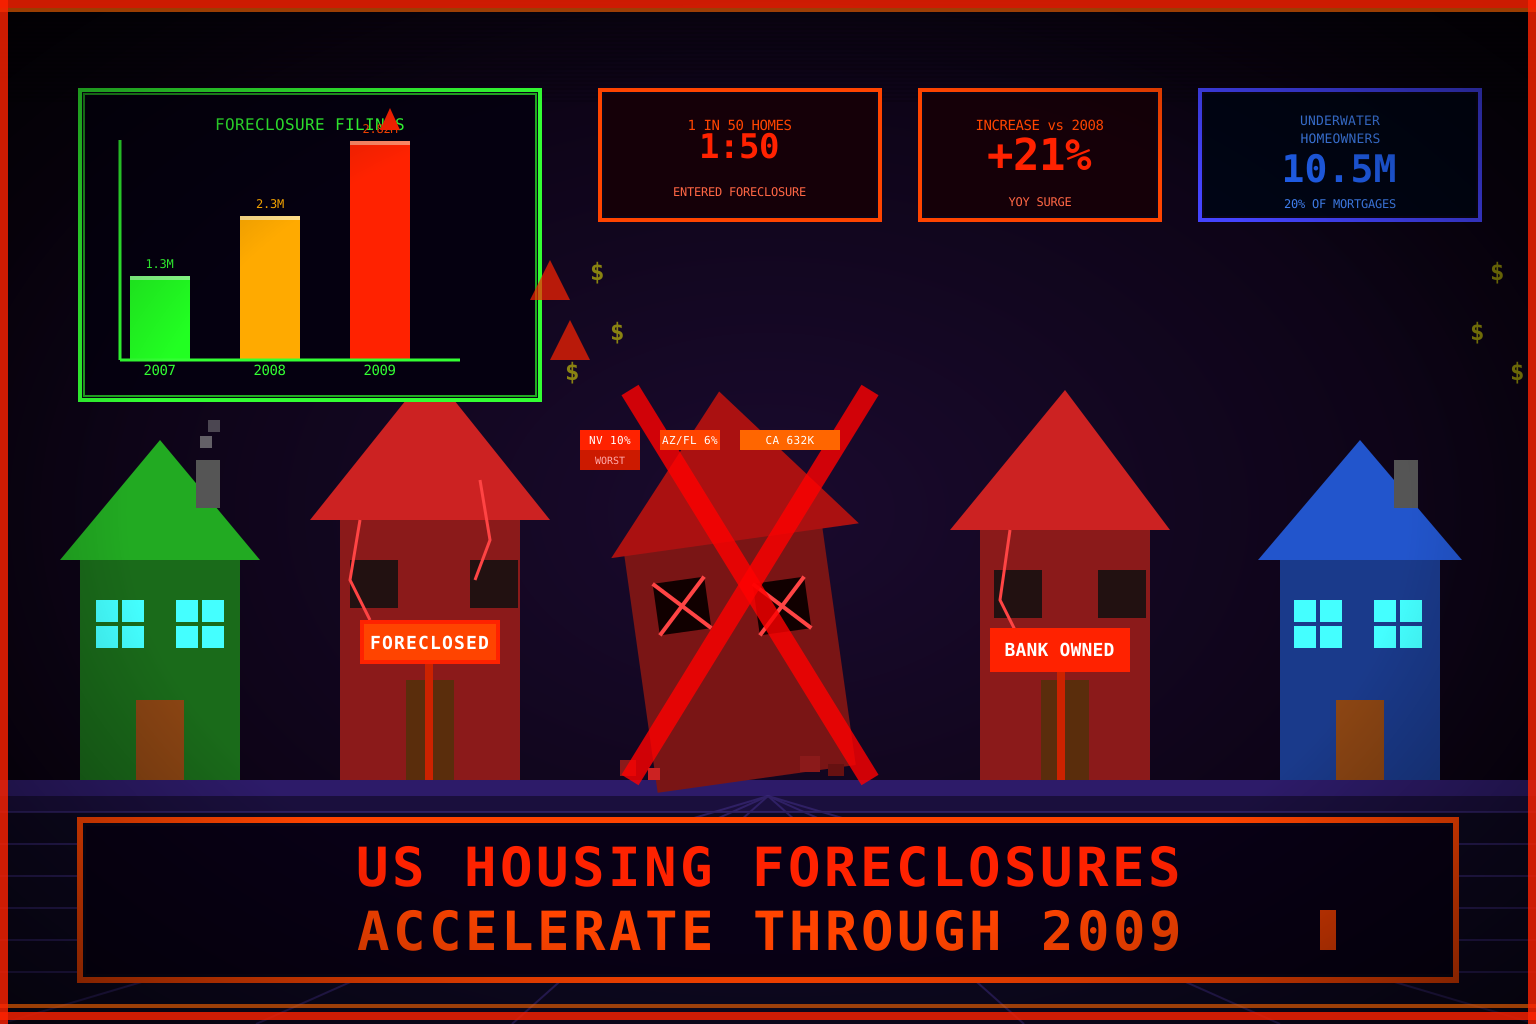
Throughout 2009, the US housing foreclosure crisis intensified dramatically, with a record 2.82 million properties receiving foreclosure filings—a staggering 21% increase over 2008 and more than double the 2007 rate. This represented approximately 1 in 50 American homes entering foreclosure proceedings within a single year. Over 1 million properties completed foreclosure sales in 2009, translating to families losing their homes at an unprecedented pace. The crisis was heavily concentrated geographically, with Nevada experiencing foreclosure rates exceeding 10% of all housing units, Arizona and Florida near 6%, and California accounting for 632,573 foreclosure filings—4.75% of the state’s homes. Between mid-2006 and the end of 2009, the cumulative toll reached 6 million foreclosure proceedings—more than a six-fold increase from pre-crisis rates.
The foreclosure surge reflected a toxic combination of economic conditions unleashed by the Great Recession. Falling home prices left an estimated 10.5 million homeowners (20% of all properties with mortgages) underwater—owing more on their mortgages than their homes were worth—eliminating the equity cushion that might have motivated continued payment. Simultaneously, the employment collapse pushed unemployment toward 10%, directly triggering defaults among workers who lost income. Subprime mortgages and adjustable-rate loans issued during the 2000s bubble compounded the crisis as rates reset to unaffordable levels. Many homeowners who had weathered falling prices through 2008 exhausted their savings in 2009 and could no longer sustain payments, creating a second and third wave of defaults after the initial 2007–2008 surge.
Background: The Housing Bubble and Its Collapse
The 2009 foreclosure acceleration was the culmination of a decade-long housing bubble that inflated US home prices by roughly 124% nationally between 1997 and 2006, according to the Case-Shiller Home Price Index. Low interest rates, lax lending standards, and investor appetite for mortgage-backed securities had enabled millions of Americans to obtain mortgages they could sustain only as long as prices rose. When the bubble peaked in mid-2006, prices began an unprecedented decline: by the end of 2009, the S&P/Case-Shiller National Home Price Index had fallen approximately 32% from its peak, erasing some $7 trillion in household wealth.
The seeds of the 2009 crisis were planted in the origination practices of 2003–2006. During those years, “exotic” mortgage products proliferated: option ARMs (adjustable-rate mortgages that allowed negative amortization), interest-only loans, and 2/28 hybrid ARMs that offered low teaser rates for two years before resetting sharply higher. By 2009, millions of these loans had either already defaulted or were approaching reset dates, adding a scheduled wave of defaults atop the unemployment-driven surge. According to the Mortgage Bankers Association, the delinquency rate on all residential mortgages reached 9.47% in the third quarter of 2009, more than double the 4.1% rate recorded at the start of 2008.
Timeline of Key Events in 2009
January 2009: Foreclosure filings for the first month of the year total 274,399—nearly double the rate of January 2007. Obama transition team begins drafting housing relief proposals alongside the broader stimulus plan.
February 18, 2009: One day after signing the American Recovery and Reinvestment Act, President Obama announces a $275 billion housing rescue plan at a speech in Mesa, Arizona, one of the hardest-hit metro areas in the country. The plan is split between $75 billion in direct mortgage relief and $200 billion in additional support for Fannie Mae and Freddie Mac.
March 4, 2009: The Treasury Department releases details of the Home Affordable Modification Program (HAMP), targeting 3–4 million at-risk borrowers. Servicers receive $1,000 per loan modified, with additional incentives for performance. Participation is voluntary for lenders not under federal conservatorship.
April 2009: RealtyTrac reports 342,038 foreclosure filings in March 2009—the highest monthly total since the firm began tracking data in 2005. One in every 379 US housing units received a filing that month.
June 1, 2009: General Motors files for Chapter 11 bankruptcy, and Chrysler completes its bankruptcy the same month, eliminating hundreds of thousands of auto-sector jobs in Michigan, Ohio, and Indiana. Auto-belt states, already under housing pressure, face an additional surge in mortgage delinquencies as laid-off workers default.
July 2009: Despite the recession’s official end in June, foreclosure filings for the second quarter of 2009 hit 889,829—the highest quarterly total on record. RealtyTrac CEO James Saccacio warns that a “shadow inventory” of seriously delinquent loans not yet in formal foreclosure proceedings represents a looming second wave.
October 2009: The unemployment rate peaks at 10.2%, adding direct payment-default pressure on homeowners already facing negative equity. That same month, the Special Inspector General for TARP (SIGTARP) issues a report criticizing HAMP’s slow rollout: only 651,000 trial modifications had begun, against a target of 3–4 million.
December 2009: Full-year foreclosure data confirms 2.82 million filings on 2.21 million distinct properties, with 918,000 properties lost to bank repossession. Lenders take title to a record $54 billion in US residential property during the year.
Geographic Concentration and Community Impact
The foreclosure crisis was strikingly uneven. Five states—California, Florida, Arizona, Nevada, and Michigan—accounted for approximately 65% of all US foreclosure activity in 2009, reflecting their outsized participation in the housing bubble. Nevada’s rate of 1 in 10 homes receiving a filing was the highest in the nation; in hard-hit ZIP codes in Las Vegas and Reno, abandonment rates exceeded 20%, leaving neighborhoods with block after block of vacant, deteriorating homes.
In California, Riverside and San Bernardino counties in the Inland Empire—areas that had experienced some of the most aggressive subprime lending in the country—recorded foreclosure rates above 8%. Sacramento County, once a model of Sun Belt growth, had one in every 34 homes enter foreclosure. Florida’s Cape Coral–Fort Myers metropolitan area, which had expanded explosively on speculative condo development, led Florida metros with a foreclosure rate of approximately 9%.
The geographic clustering of foreclosures amplified economic damage through neighborhood effects. Research published in 2009 by the Federal Reserve Bank of Chicago found that each proximate foreclosure reduced surrounding property values by 0.9%, meaning a neighborhood with ten foreclosed homes suffered roughly a 9% decline in property values even for owners who kept up their payments. Municipal governments in hard-hit areas saw property tax revenues collapse—a particular crisis for states like California and Michigan that fund education and services heavily through property taxes.
The Federal Response: HAMP and Its Limitations
The Obama administration’s principal housing tool was the Home Affordable Modification Program, announced in February 2009. Under HAMP, the Treasury paid mortgage servicers to modify loans for borrowers facing imminent default: servicers were required to reduce monthly payments to no more than 31% of the borrower’s gross income by lowering interest rates (to as low as 2%), extending loan terms (to 40 years), and in some cases deferring principal. The program was funded with $50 billion from the Troubled Asset Relief Program (TARP), appropriated under the previous Bush administration.
By the end of 2009, HAMP’s results were far short of targets. The program had begun 787,231 trial modifications—which required borrowers to make three months of payments at the modified rate before the modification became permanent—but only 31,382 had been converted to permanent modifications by year-end. Servicer capacity was a key constraint: many loan servicers lacked the staffing and systems to process the volume of modification requests, and the program’s rules required extensive income documentation that many distressed borrowers struggled to produce. Critics from advocacy groups noted that the trial modification process left borrowers in limbo for months, sometimes resulting in larger delinquent balances when trials were ultimately denied.
Economist Morris Davis of the Lincoln Institute of Land Policy, writing in late 2009, identified the program’s core conceptual flaw: HAMP could reduce monthly payments, but it could not address negative equity. Borrowers who owed $300,000 on a home worth $200,000 remained underwater even after modification, and underwater borrowers had strong incentive to default regardless of monthly payment levels. Davis argued that effective intervention required principal reduction—writing down loan balances to market value—but the administration and servicers resisted this approach due to cost, legal complexity, and moral-hazard concerns.
Significance
The accelerating foreclosures of 2009 transformed the housing crisis from a financial sector disaster into a mass displacement event. Each foreclosure represented not merely a loan default but a family losing its primary asset, with cascading consequences for children’s schooling, community ties, and long-term wealth accumulation. Research by the Urban Institute found that children in families that experienced foreclosure were more likely to repeat grades, change schools mid-year, and show elevated rates of anxiety and depression. For adults, a foreclosure remained on credit records for seven years under standard reporting rules, limiting access to rental housing, car loans, and future homeownership.
The 2009 foreclosure wave also reshaped the US residential real estate market structurally. Large private equity firms, including the early stages of what would become Invitation Homes (backed by Blackstone) and similar institutional landlords, began purchasing foreclosed properties in bulk, converting owner-occupied homes into rental units in Sun Belt metros. This shift—enabled by the distressed pricing of foreclosed inventory—contributed to a decades-long decline in homeownership rates, which peaked at 69.2% in 2004 and fell to 63.7% by 2016.
The 2009 crisis and the failure of HAMP informed significant policy discussions about mortgage market design, servicer accountability, and the moral dimensions of allowing strategic default. The lessons of the 2009 foreclosure peak, particularly the inadequacy of purely payment-focused relief without addressing negative equity, shaped academic and policy debates about housing-crisis response for the following decade—debates that were revisited, with different conclusions, during the COVID-19 pandemic mortgage relief programs of 2020–2021.
Sources
- Reflections on the Foreclosure Crisis — Lincoln Institute of Land Policy
- Foreclosures Eclipse Record in 2009 — Housing Predictor
- Making Home Affordable Program — HAMP Overview — US Treasury Department
- Mortgage Delinquencies and Foreclosures (2009 Q3 MBA Survey) — Mortgage Bankers Association
- The Impact of Foreclosures on Neighboring Housing Sales — Federal Reserve Bank of Chicago