Key figures: Bureau of Labor Statistics Commissioner Keith Hall, US Labor Secretary Hilda Solis, Council of Economic Advisers Chair Christina Romer, Federal Reserve Chair Ben Bernanke
Summary
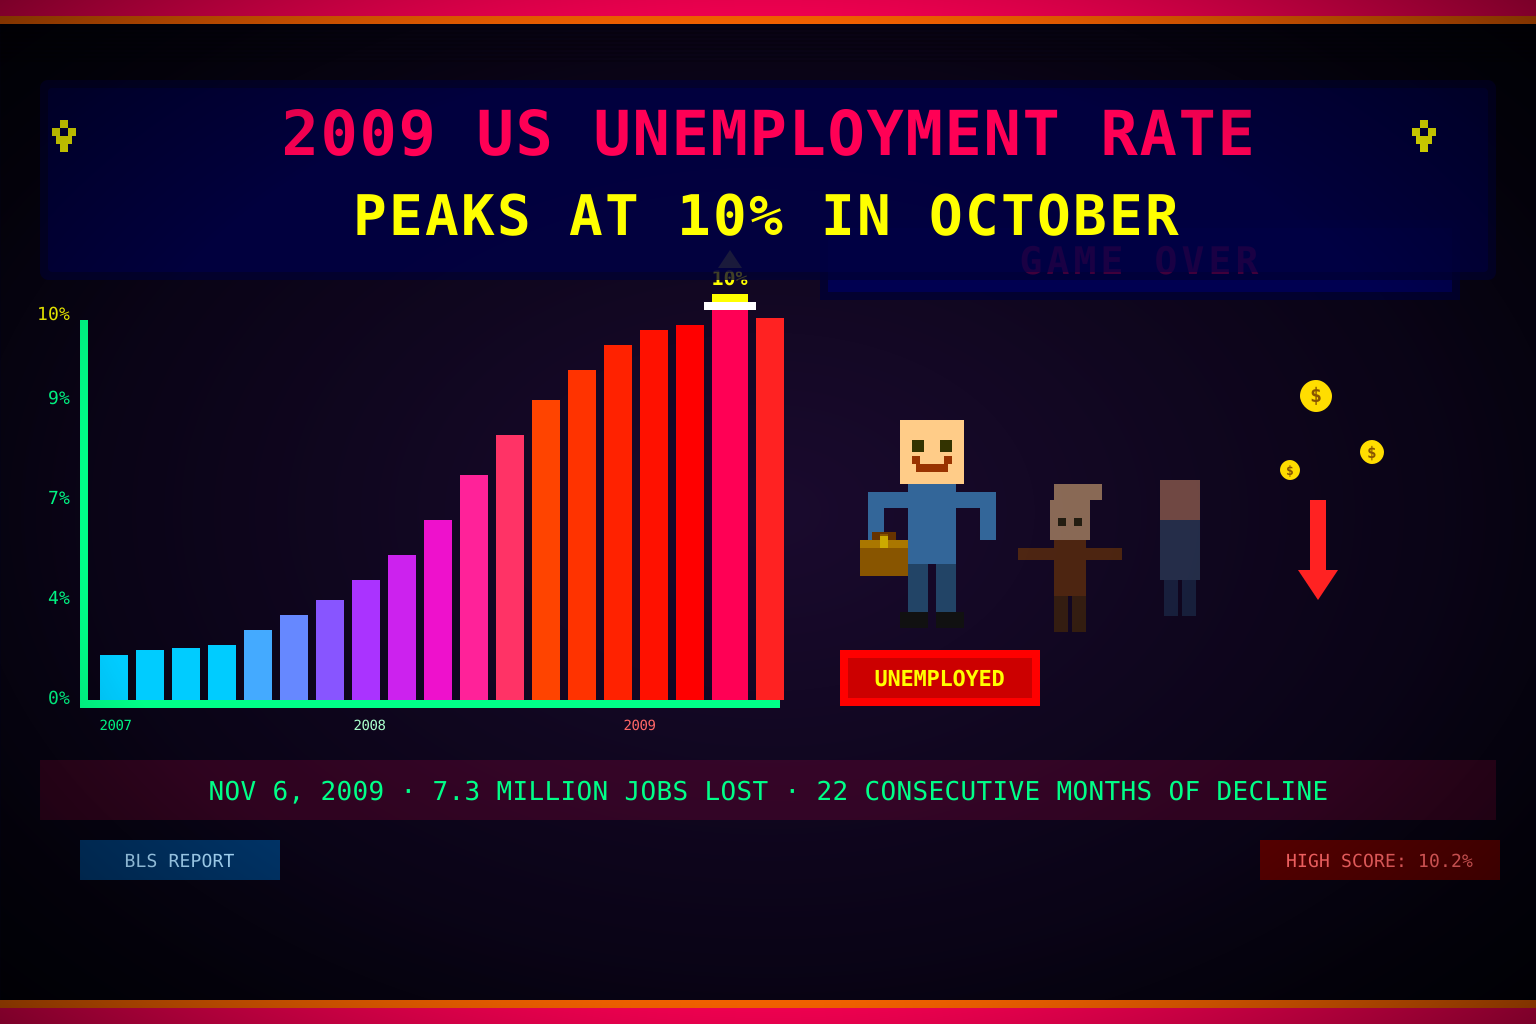
In October 2009, the US unemployment rate surged to 10.2%, reaching its highest level since April 1983 and marking the peak of the Great Recession’s devastating impact on American workers. The Bureau of Labor Statistics reported on November 6, 2009 that the economy shed an additional 190,000 jobs in October—bringing total nonfarm payroll losses since the recession began in December 2007 to 7.3 million (a figure later revised upward to roughly 8.7 million after benchmark revisions and the market’s February 2010 trough). This milestone represented the 22nd consecutive month of job losses, the longest streak since the Great Depression era, and left more than 15.7 million Americans officially jobless. While the National Bureau of Economic Research would later determine that the recession ended in June 2009, the labor market remained in deepening crisis as the unemployment rate climbed through the autumn, underscoring the severe lag that characterizes employment recovery after financial-crisis recessions.
The October unemployment peak reflected the cumulative impact of nearly two years of sustained job destruction. The worst months had come from November 2008 through April 2009, when the economy averaged 645,000 job losses monthly—the most severe sustained employment collapse since the 1930s. By October 2009, the pace had slowed to approximately 188,000 monthly, and the administration of President Barack Obama pointed to this deceleration as evidence that the American Recovery and Reinvestment Act, signed in February 2009, was beginning to work. Nonetheless, the headline unemployment rate continued to climb even as underlying job-loss rates moderated—a phenomenon economists attributed to “discouraged workers” re-entering job searches as conditions stabilized, paradoxically pushing measured unemployment upward.
Background: Two Years of Job Destruction
The labor market deterioration that produced the October 2009 peak had begun in December 2007, the official start of the Great Recession as later designated by the NBER. At that point the unemployment rate stood at 4.9%—near a multi-decade low—and few forecasters anticipated the scale of what was coming. The recession initially progressed at a manageable pace: the economy shed 232,000 jobs through the first three months of 2008, a painful but not exceptional rate.
The September 2008 financial crisis—triggered by the collapse of Lehman Brothers on September 15 and the near-failure of the global interbank lending system—accelerated the labor market collapse dramatically. Monthly job losses swelled: November 2008 saw 803,000 jobs eliminated, December 2008 saw 661,000, and January 2009 saw 741,000. In total, the three months from November 2008 through January 2009 destroyed nearly 2.2 million jobs. This rate of job destruction had no precedent in the postwar data.
The financial system stabilization efforts of late 2008 and early 2009—including TARP, the Federal Reserve’s emergency lending programs, and the subsequent bank stress tests of spring 2009—prevented a total financial collapse but could not immediately reverse the employment spiral. Businesses facing falling demand, tightening credit, and deep uncertainty about the future slashed payrolls, inventories, and investment simultaneously, amplifying the demand shortfall that the job losses themselves were creating.
Month-by-Month Deterioration: December 2007 – October 2009
The BLS data told a story of escalating crisis followed by slow moderation:
- December 2007: 90,000 jobs lost; unemployment 4.9%
- January–March 2008: 232,000 total jobs lost; unemployment rises to 5.1%
- April–June 2008: 487,000 total jobs lost; unemployment reaches 5.6%
- July–September 2008: 514,000 total jobs lost; unemployment 6.1% at September month-end
- October 2008: 423,000 jobs lost; unemployment 6.5%
- November 2008: 803,000 jobs lost (later revised to 728,000)
- December 2008: 661,000 jobs lost; unemployment 7.3%
- January 2009: 741,000 jobs lost; unemployment 7.8%
- February 2009: 726,000 jobs lost; unemployment 8.3%
- March 2009: 787,000 jobs lost; unemployment 8.7%—the worst single month
- April 2009: 699,000 jobs lost; unemployment 9.0%
- May 2009: 361,000 jobs lost—a sharp deceleration attributed partly to ARRA effects
- June 2009: 467,000 jobs lost; recession ends (per NBER), though labor market continues deteriorating
- July 2009: 327,000 jobs lost; unemployment 9.4%
- August 2009: 216,000 jobs lost; unemployment 9.7%
- September 2009: 227,000 jobs lost; unemployment 9.8%
- October 2009: 190,000 jobs lost; unemployment peaks at 10.2%
The peak pace of destruction—March 2009’s 787,000 jobs in a single month—was the worst monthly figure since records began in 1939.
Industry Breakdown: Where Jobs Disappeared
The 2008–2009 job losses were heavily concentrated in goods-producing and related sectors, reflecting the construction collapse and manufacturing contraction that accompanied the housing bust and demand shock:
Construction: Lost 1.6 million jobs between January 2007 and October 2009, a decline of more than 22%. The collapse of residential construction—housing starts fell from 2.07 million in 2005 to 554,000 annualized by early 2009—drove this sector’s devastation. The accelerating housing foreclosures of 2009 directly eliminated demand for new construction, as banks and developers had no incentive to build while hundreds of thousands of existing units sat vacant.
Manufacturing: Lost 2.1 million jobs from December 2007 to October 2009, a drop of 14.5%. Auto-related manufacturing was particularly hard-hit: the General Motors bankruptcy in June 2009 and Chrysler’s April 2009 reorganization eliminated tens of thousands of direct jobs and rippled through thousands of supplier firms. Michigan’s unemployment rate reached 15.1% in August 2009—the highest of any state.
Financial services: Lost approximately 350,000 jobs as banks, insurance companies, and mortgage servicers downsized in the wake of the financial crisis. The stress test results published in May 2009 stabilized the sector, but hiring remained suppressed through the end of the year.
Retail trade: Lost 600,000 jobs as consumer spending contracted sharply. Household saving rates rose from near zero in 2007 to approximately 5% by mid-2009 as consumers rebuilt balance sheets, directly reducing retail activity.
Health care and education were notable exceptions, adding approximately 500,000 jobs combined over the same period—a divergence that reflected both the recession-resistance of health demand and the ARRA’s substantial funding for Medicaid and school districts.
Demographic Disparities
The headline 10.2% rate masked sharply unequal unemployment experiences across demographic groups in October 2009:
- Adult men: 11.1% unemployment, reflecting their concentration in the hardest-hit goods-producing sectors
- Adult women: 8.1%, a smaller increase from their pre-recession baseline, partially attributable to higher representation in health care and education
- Teenagers (16–19): 27.6%—more than one in four young workers could not find employment, with lasting effects on early career development and lifetime earnings
- Black Americans: 15.7%, reflecting both occupational concentration in vulnerable sectors and pre-existing gaps in access to stable employment
- Hispanic Americans: 13.1%
- White Americans: 9.3%
- Long-term unemployed (27 weeks or more): 5.6 million workers, representing 35.6% of all unemployed—a record share. The median duration of unemployment reached 18.7 weeks in October 2009, double the pre-recession median.
The long-term unemployment figures were particularly alarming to labor economists. Research by Princeton economist Alan Krueger and others found that workers unemployed for more than six months faced dramatically lower callback rates from employers, creating a self-reinforcing cycle of exclusion that some economists termed “unemployment scarring.” Workers who experienced extended unemployment in 2009 faced lower wages and shorter job tenures even years after reemployment.
Policy Response
American Recovery and Reinvestment Act (February 2009): The $787 billion stimulus package enacted six weeks before the unemployment rate hit 8% was projected by the administration to prevent unemployment from exceeding 8%. The projection proved incorrect because the recession proved deeper than early 2009 estimates recognized—January 2009 data available to policymakers at the time understated actual job losses, which were revised upward substantially in subsequent BLS benchmarking. Nonetheless, the CBO estimated in subsequent analyses that ARRA saved or created between 1.4 and 3.3 million jobs at its peak effect.
Unemployment insurance extensions: Congress repeatedly extended federal unemployment benefits, ultimately allowing workers to receive up to 99 weeks of combined state and federal benefits. At the October 2009 peak, approximately 9.5 million workers were receiving some form of unemployment insurance, an unprecedented volume that strained state UI trust funds. The federal government advanced loans to states whose UI funds became insolvent.
Federal Reserve policy: The Federal Reserve held its benchmark federal funds rate at 0–0.25% throughout 2009 and launched the first of its quantitative easing programs (QE1) in November 2008, purchasing $1.25 trillion in mortgage-backed securities by March 2010. These measures lowered long-term interest rates and stabilized financial conditions but could not directly address the structural demand shortfall driving unemployment.
Job training and placement: ARRA allocated $4.7 billion for worker training through the Workforce Investment Act, and the Labor Department expanded funding for Trade Adjustment Assistance (TAA) to cover workers displaced by import competition. Critics noted that retraining programs had limited effectiveness when there were far fewer job openings than unemployed workers—a structural rather than skills mismatch.
Significance
The October 2009 unemployment peak symbolized the depth and persistence of the Great Recession, transforming abstract economic statistics into mass human hardship. For demographic subgroups, conditions were even grimmer: male unemployment reached 11.1%, teen unemployment soared to 27.6%, and long-term unemployment reached record levels. For millions of households, unemployment intersected directly with the housing foreclosure crisis: workers who lost jobs could no longer make mortgage payments, and foreclosed homeowners found it harder to relocate for employment because underwater properties could not be sold without cash to cover the shortfall.
The employment crisis persisted far longer than earlier postwar recessions, illustrating the severity of financial-crisis recessions relative to inventory-cycle downturns. The unemployment rate did not return to 5%—where it stood at the recession’s December 2007 start—until December 2015, nearly eight years later. This prolonged recovery meant that workers displaced in 2008 and 2009 faced years of underemployment, wage suppression, and career disruption. Research published in the years following found that workers who entered the labor market during the 2008–2009 crisis earned less on average than comparable cohorts for more than a decade, a phenomenon economists termed the “scarring effect” of labor market downturns.
The October 2009 peak also reshaped political economy. The administration’s failure to prevent unemployment from exceeding the 8% projection (made before January data was fully benchmarked) became a persistent Republican talking point, contributing to the political environment that produced large Democratic losses in the November 2010 midterm elections. More broadly, the severity and persistence of the employment crisis fueled public skepticism of both TARP and ARRA, generating conditions that animated the Tea Party movement of 2009–2010 and, in subsequent years, contributed to broader public distrust of economic institutions.
Sources
- Unemployment Rises Above 10 Percent for the First Time in 26 Years — Center for American Progress
- Great Recession, great recovery? Trends from the Current Population Survey — U.S. Bureau of Labor Statistics
- Employment Situation Summary, November 2009 (October data) — U.S. Bureau of Labor Statistics
- The Long-Term Unemployed in the Aftermath of the Great Recession — Brookings Institution