Summary
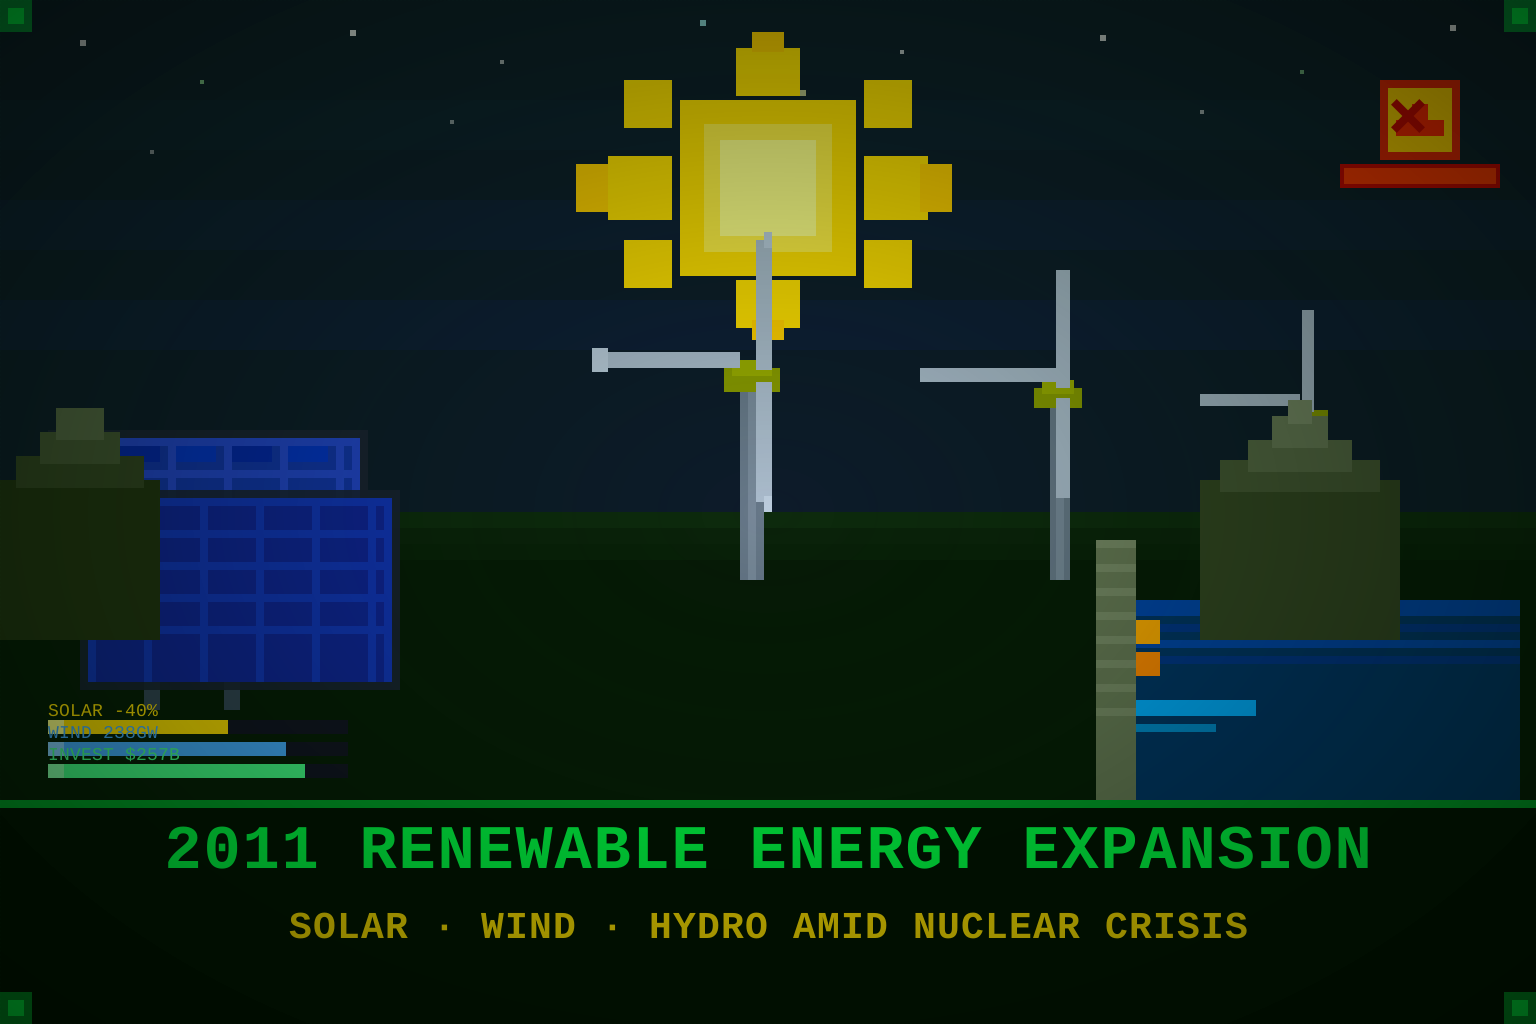
The year 2011 marked a pivotal inflection in the global energy transition, with renewable energy capacity expanding at unprecedented rates across solar, wind, and hydroelectric installations worldwide. The Fukushima Daiichi nuclear disaster on March 11, 2011 — triggered by the Tōhoku earthquake and tsunami — accelerated anti-nuclear sentiment and forced energy policy recalibration in Japan, Germany, and other nations, redirecting hundreds of billions of dollars of investment toward renewables. Simultaneously, solar photovoltaic (PV) module prices fell steeply, dropping roughly 40% over 2010–2011 from about $2.00/watt to about $1.20/watt, making utility-scale solar economically competitive for the first time in many markets.
Wind energy capacity grew by approximately 40 GW globally in 2011, bringing total installed capacity to around 238 GW, extending the dominance of onshore installations while offshore wind gained traction in Northern Europe. China accounted for nearly half of all new wind installations globally. Hydroelectric installations expanded rapidly in China, Brazil, and Southeast Asia. By year’s end, renewables accounted for approximately 19–20% of global electricity generation, a figure that would grow substantially through the following decade.
Global clean energy investment reached approximately $257 billion in 2011 — a record at the time and roughly five times the level of 2004 — according to Bloomberg New Energy Finance data. The year 2011 was the inflection point at which renewable energy shifted from environmental aspiration to economic structural force.
Significance
2011 represented the year the renewable energy transition shifted from environmental idealism to economic inevitability. The combination of technological cost curves — particularly the “learning curve” decline in solar PV prices, which had been tracking at ~20% cost reduction per doubling of cumulative capacity — and external shocks (Fukushima) created a moment when renewables became not merely aspirational but pragmatically competitive against incumbent energy sources.
The policy response was decisive and permanent:
- Germany accelerated its Energiewende (energy transition) following Fukushima, on June 6, 2011 announcing the phase-out of all 17 nuclear reactors by 2022 and a legally-binding target for renewables to supply 80% of electricity by 2050.
- Japan, despite 30+ years of nuclear dependence, shut down all but two of its 54 reactors for safety reviews by the end of 2011; most never restarted.
- China maintained its trajectory as the world’s largest renewable installer, driven by industrial policy and severe urban air pollution crisis, setting a target of 15% non-fossil energy by 2020.
- The United States saw the wind production tax credit (PTC) renewed through 2012, sustaining record U.S. wind additions of approximately 6.8 GW in 2011.
The significance extended beyond energy supply: the 2011 renewable boom signaled to capital markets, governments, and entrepreneurs that clean energy was no longer a niche market but a structural economic force. Within a decade, solar and wind would become the cheapest new energy sources in most of the world, permanently disrupting fossil fuel dominance. 2011 was the critical inflection year.
Cross-reference: Fukushima Daiichi Disaster for the nuclear crisis that catalyzed European energy policy, and Tōhoku Earthquake and Tsunami for the event’s human and structural dimensions.
Solar Energy Breakthrough
The Cost Curve
Solar photovoltaic costs plummeted in 2011, driven by Chinese manufacturing scale, competition, and supply chain efficiency. Module prices dropped from approximately $2.00/watt at the start of 2010 to $1.20/watt by year-end 2011 — a roughly 40% reduction over two years, with the sharpest declines concentrated in 2011. Between 2008 and 2011, costs had fallen by over 60%, a trajectory that followed “Swanson’s Law” (analogous to Moore’s Law for semiconductors), which predicted ~20% cost decline for every doubling of cumulative capacity. Analysts at that time projected further cost reductions; by 2020, module prices had fallen below $0.20/watt.
Global solar PV installations in 2011 totaled approximately 30 GW of new capacity, bringing cumulative global PV capacity to roughly 70 GW. For context, global solar installations in 2010 were approximately 17 GW; the 2011 figure nearly doubled in one year.
Germany’s Photovoltaic Boom
Germany’s feed-in tariff (FIT) policies guaranteed renewable energy payments at above-market rates, triggering a rush of residential and commercial rooftop installations. By end-2011, Germany had installed approximately 25 GW of cumulative PV capacity — by far the world’s largest per-capita solar deployment despite mediocre solar irradiance (comparable to Alaska by U.S. standards). Germany’s rapidly growing fleet increasingly supplied a large share of midday demand; the boom carried into 2012, when on May 25–26 German solar set a then-world record of about 22 GW in a single midday hour, briefly meeting nearly half of the country’s electricity demand from the sun.
Germany’s FIT system came under pressure in 2011 from its own success: the cost of guaranteed payments to solar generators — borne by electricity consumers via a surcharge — grew to approximately €13 billion annually by 2012, prompting subsidy reforms but not reversal of expansion targets.
Utility-Scale Solar and the Desertec Initiative
Utility-scale solar (farms supplying grid electricity, not rooftop installations) crossed economic parity with coal and natural gas in select high-sun regions in 2011, particularly the U.S. Southwest, Southern Europe, and the Middle East. The U.S. saw several large-scale solar projects commissioned or under construction in 2011, including the Blythe Solar Power Project in California (planned for 1 GW but later restructured).
The Desertec initiative, a European-led consortium announced in 2009, gained serious traction in 2011: the vision was to harness North African and Middle Eastern solar and wind resources and export power to Europe via high-voltage direct current (HVDC) undersea cables. By 2011, DII GmbH (Desertec Industrial Initiative) had attracted investments from Siemens, Deutsche Bank, and Munich Re. The initiative ultimately faced geopolitical obstacles — particularly the Arab Spring’s destabilization of North Africa — and was scaled back significantly by 2014. Its legacy was to demonstrate that trans-continental renewable energy transmission was technically feasible and economically arguable.
Wind Energy Expansion
Global Capacity Growth
Global wind capacity additions reached approximately 40 GW in 2011, compared to 35 GW in 2010, with total installed capacity reaching 238 GW — a roughly 20% year-over-year increase. The compound annual growth rate for wind energy capacity from 2006–2011 averaged approximately 25%.
China accounted for approximately 18 GW of new installations in 2011 alone, making it the world’s largest wind market by far. By year-end 2011, China’s total installed wind capacity reached approximately 62 GW, surpassing the United States (approximately 47 GW total) as the absolute leader. Chinese wind farms concentrated in Inner Mongolia, Xinjiang, and coastal provinces, though grid integration challenges meant a significant percentage of generated wind electricity was “curtailed” (wasted) due to transmission bottlenecks — a problem not fully resolved until the late 2010s.
The United States added approximately 6.8 GW of new wind capacity in 2011, driven by Texas, Iowa, and Great Plains states. The American wind industry was heavily dependent on the federal Production Tax Credit (PTC), which expired and was renewed in cycles; uncertainty over PTC renewal caused boom-bust installation patterns.
Offshore Wind Takes Root
Offshore wind, nascent in 2011, gained momentum primarily in Northern Europe. The UK led global offshore wind development, with projects such as the Sheringham Shoal wind farm (off Norfolk, UK, 317 MW, commissioned 2012) and Greater Gabbard (504 MW, UK, commissioned 2012) under construction. Denmark’s Anholt Offshore Wind Farm (400 MW) was also in development. Total global offshore wind capacity at end-2011 was approximately 3.8 GW — a small fraction of onshore, but growing rapidly.
Offshore wind costs in 2011 remained approximately 2–3× higher than onshore due to installation complexity, marine cabling, and operation and maintenance challenges. Industry projections — later validated — suggested offshore costs would decline substantially through the 2010s.
Turbine Technology Advances
Wind turbines advanced significantly in 2011:
- 5 MW+ offshore turbines were commercialized, doubling rated capacity from typical 2006-era 2.5 MW machines.
- Vestas (Denmark) and Siemens (Germany, via its wind division) led turbine manufacturing, with Vestas holding the largest global market share.
- China emerged as a major turbine producer: SINOVEL, Goldwind, and DongFang Wind Power collectively captured approximately 30% of global turbine manufacturing.
- Rotor diameters grew from ~80 meters (typical 2006) to ~90–100 meters, increasing energy capture at any given wind speed.
Hydroelectric and Energy Storage
China’s Hydro Expansion
China remained the world’s largest hydroelectric producer in 2011, adding capacity across the Yangtze River system and Tibetan Plateau tributaries. The Three Gorges Dam — commissioned for full operation in 2012 — was approaching its installed capacity of 22.5 GW, making it by far the world’s largest power station of any type. Additional Chinese dam projects in Yunnan and Sichuan provinces were under construction, targeting southwestern river systems with large vertical drops.
Brazil, with its Amazon basin hydro resources, similarly expanded. The Belo Monte Dam in the Pará state — which would become the world’s third-largest hydroelectric plant at 11.2 GW — began construction in 2011, although it faced significant environmental and indigenous rights opposition.
Energy Storage and Grid Integration
As variable renewable sources (wind, solar) grew, grid integration became a central technical challenge. Existing electricity grids, designed for stable baseload and dispatchable peaking power, needed adaptation for intermittent generation:
- Pumped-hydro storage — using surplus renewable electricity to pump water uphill into reservoirs, then releasing it through turbines when demand spikes — was the world’s most mature large-scale storage technology, representing approximately 99% of global grid energy storage capacity in 2011, totaling roughly 127 GW worldwide.
- Lithium-ion battery costs remained approximately $1,000/kWh in 2011, limiting utility-scale deployment. However, the automotive electrification boom — driven by Nissan LEAF (launched late 2010) and early Tesla Model S development — was already funding battery cost reduction at scale.
- Smart grid investments — sensors, advanced metering, demand-response software — accelerated in the U.S. and Europe in 2011, partly driven by American Recovery and Reinvestment Act funding (U.S., 2009–2011) and EU smart grid directives.
Cross-reference: Scientific Discoveries of 2011 for Nobel prizes and major discoveries in physics and chemistry relevant to energy technology.
Nuclear Crisis Catalyzes Policy Shift
The Fukushima Effect
The Fukushima Daiichi disaster — a Level 7 nuclear accident (the maximum on the INES scale, matching Chernobyl) triggered on March 11, 2011, by the Tōhoku earthquake and tsunami — proved catalytic for renewable energy policy globally. Three of Fukushima’s six reactor units suffered core meltdowns, releasing radioactive cesium and iodine into the atmosphere and Pacific Ocean, and forcing the evacuation of approximately 154,000 residents.
Japan, which had relied on nuclear for approximately 30% of electricity generation, shut down reactor after reactor for safety reviews following Fukushima. By May 2012, all 54 reactors were offline — a near-total nuclear shutdown lasting years, replaced partially by fossil fuels (particularly LNG) and motivating accelerated renewable investment.
Germany’s response was most dramatic: on March 14, 2011 — three days after the disaster — Chancellor Angela Merkel announced the immediate shutdown of Germany’s seven oldest nuclear reactors and ordered safety reviews of the remaining ten. On June 30, 2011, the German parliament (Bundestag) voted 513–79 to phase out all nuclear power by 2022, enshrining the Energiewende in law. This made Germany effectively the world’s largest laboratory for high-renewables grid integration at scale.
Switzerland voted in May 2011 to phase out nuclear power gradually (the last Swiss reactor scheduled for 2034). Belgium announced plans to close its nuclear plants by 2025. No new nuclear orders were placed in Western Europe after 2011, marking the effective end of a potential nuclear renaissance in the developed world.
Economic Impact of Nuclear Withdrawal
Germany’s post-Fukushima nuclear phase-out created a significant energy policy tension: retiring zero-carbon nuclear capacity required either increased renewable capacity faster than planned, or — in the short term — increased fossil fuel combustion (particularly coal and lignite). German coal and lignite generation actually increased slightly in 2011–2013 even as renewables expanded, because the combination of nuclear retirement and unreliable renewable generation required dispatchable backup. This “energy trilemma” — balancing security, affordability, and sustainability — would define Germany’s energy policy debates for the following decade.
Cross-reference: Fukushima Daiichi Disaster and Tōhoku Earthquake and Tsunami.
Global Investment Landscape
According to Bloomberg New Energy Finance data, global clean energy investment in 2011 totaled approximately $257 billion — a record at the time, representing roughly 5× the 2004 figure:
| Region | 2011 Clean Energy Investment |
|---|---|
| China | ~$52 billion |
| United States | ~$48 billion |
| Germany | ~$31 billion |
| Italy | ~$28 billion |
| Brazil | ~$7 billion |
| Rest of World | ~$91 billion |
The United States’ $48 billion included substantial stimulus funding from the American Recovery and Reinvestment Act of 2009, which allocated approximately $90 billion to clean energy across 2009–2012, making it the largest clean energy investment program in U.S. history to that date. The Solyndra controversy — a solar company that received $535 million in federal loan guarantees before going bankrupt in September 2011 — dominated U.S. political debate about clean energy subsidies, though Solyndra’s failure reflected competitive pressure from Chinese manufacturing rather than fundamental technology failure.
Emerging Technologies (2011 State of Play)
Advanced energy storage beyond pumped hydro received increasing R&D attention:
- Flow batteries (vanadium redox, zinc-bromine) were demonstrated at small commercial scale (100 kW to 1 MW), but costs remained prohibitive for large grid applications.
- Compressed Air Energy Storage (CAES) had two commercial plants operating (McIntosh, Alabama, since 1991; Huntorf, Germany, since 1978) but no new projects were advancing to commercial scale.
- Concentrated Solar Power (CSP) with thermal storage — using molten salt to store solar heat and generate electricity overnight — attracted significant investment in Spain and the U.S. Southwest; Spain’s Gemasolar plant (19.9 MW, Seville) became in 2011 the first commercial-scale CSP plant with full 15-hour thermal storage, enabling 24-hour solar operation.
Smart grid / demand response: The U.S. had deployed approximately 36 million smart meters by end-2011, representing about 28% of residential customers. The European Union’s 2009 Third Energy Package required 80% smart meter deployment across member states by 2020.
Cross-reference: Nobel Prizes 2011 — the Nobel Prize in Chemistry was awarded to Dan Shechtman for quasicrystals discovery; while not directly renewable-energy related, 2011 Nobel science prizes reflected a broader era of materials science advances underpinning solar cell development.
Related
- Fukushima Daiichi Disaster — the March 2011 nuclear accident that catalyzed the post-Fukushima shift toward renewables
- Tōhoku Earthquake and Tsunami — the natural disaster that triggered the nuclear crisis
- Scientific Discoveries & Breakthroughs of 2011 — the year’s wider science context, including materials advances underpinning solar technology
- Nobel Prizes 2011 — the 2011 science laureates
Sources
- Bloomberg New Energy Finance. Global Clean Energy Investment 2011 Year in Review. BNEF, 2012.
- Global Wind Energy Council (GWEC). Global Wind Report 2011. Brussels: GWEC, 2012. https://gwec.net/
- IEA (International Energy Agency). Renewables 2011: Medium-Term Market Report. Paris: OECD/IEA, 2011.
- International Renewable Energy Agency (IRENA). Renewable Power Generation Costs in 2012. Abu Dhabi: IRENA, 2013. [Includes 2011 baseline data]
- REN21 (Renewable Energy Policy Network for the 21st Century). Renewables 2012 Global Status Report. Paris: REN21 Secretariat, 2012.
- German Federal Ministry for Economic Affairs and Energy. The Energy of the Future: First Monitoring Report on the Energy Transition (2012). Berlin: BMWi, 2012.
- Lovins, Amory B. Reinventing Fire: Bold Business Solutions for the New Energy Era. Chelsea Green Publishing, 2011.
- Bazilian, M., et al. “Considering the Energy, Water and Food Nexus: Towards an Integrated Modelling Approach.” Energy Policy 39, no. 12 (2011): 7896–7906.
- Pfeiffer, A., et al. “The ‘2°C capital stock’ for electricity generation: Committed cumulative carbon emissions from the electricity generation sector and the transition to a green economy.” Applied Energy (based on 2011 data, published 2016).